
Querying Segments Using the "Nearest" Geometry
StreetLight Advanced Traffic Counts API
This example shows the intended workflow and sequence of requests to make with the StreetLight Advanced Traffic Counts API through a scenario where a company can use StreetLight Advanced Traffic Counts to help inform an important decision.
Scenario
A drive-thru restaurant company in Los Angeles wants to build a new location. They want to see which potential sites have the most traffic. We can use StreetLight Advanced Traffic Counts to get metrics for roads near a site and help them decide where to build the new location.
Before you beginYou can use the example calls below as a starting point for your own calls with cURL. Replace
[API Key]with your own API key for the calls to be successful. For more information, see Authentication.
1. Check available dates 📅
To begin, we make a call to the date_ranges endpoint to check the dates for which metrics are available. Since we're interested in traffic that would drive to the restaurant, we only check the vehicle travel mode. We are interested in metrics from 2021, so we want to confirm that months in 2021 are available.
curl --request GET \
     --url https://api.streetlightdata.com/satc/v1/date_ranges/us/vehicle \
     --header 'accept: application/json' \
     --header 'x-stl-key: [API key]'
The response would be similar to the following, which is truncated for brevity:
{
  "months": [
    {
      "month": 1,
      "year": 2019
    },
    {
      "month": 2,
      "year": 2019
    },
...
    {
      "month": 4,
      "year": 2022
    }
  ],
  "status": "done",
  "years": [
    {
      "year": 2019
    },
    {
      "year": 2020
    },
    {
      "year": 2021
    }
  ]
}
Based on the response, we see that the data we are interested in is available, so we can continue on to define the geometry for which we want metrics.
For more information, see Check available data periods.
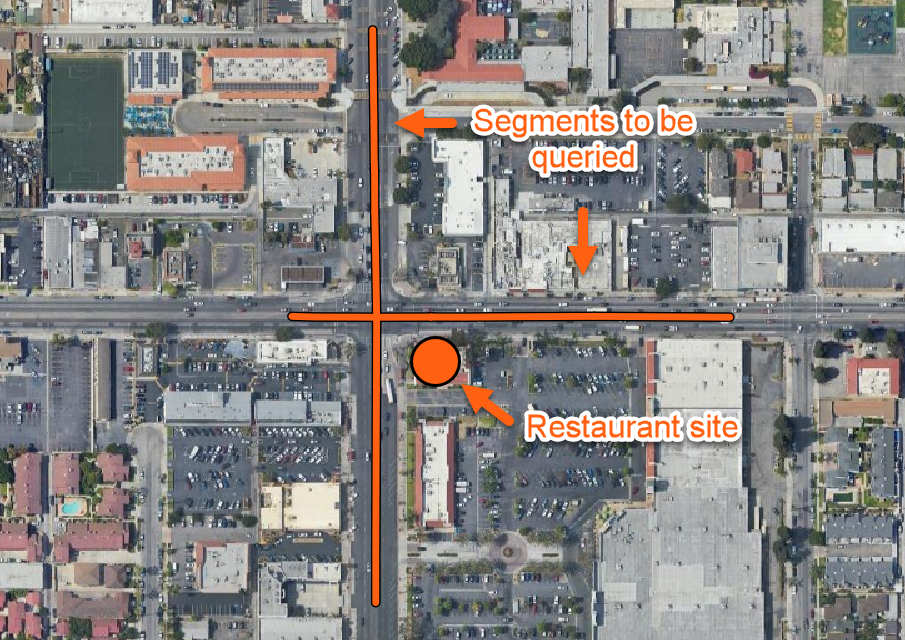
2. Identify the geometry to study 🔍
We define the geometry to be the 10 road segments nearest a pair of coordinates that defines a potential site location. This is one of multiple ways to define geometry.
We define the geometry in the same way for all the endpoints, so the following information is required for each call:
- Coordinates: 33.987018° N, 118.224968° W
- Nearest 10 segments
We use this information in API calls in the steps below.
For more information, see Defining Geometry.
3. Get geometry data in GeoJSON format 📍
Before requesting metrics, we get StreetLight Segment IDs and GeoJSON line strings for the segments we are analyzing so we can visualize the individual segments in a GIS tool. To visualize the geometry, we use the geometry endpoint.
StreetLight charges for calls to the metrics endpoint based on the number of StreetLight segments queried and the metrics fields requested. We define geometry with the nearest parameter so we can specify the exact number of segments for which we want metrics. For other geometry types, we can use the Segment count endpoint to determine how many segments are in a geometry.
curl --request POST \
     --url https://api.streetlightdata.com/satc/v1/geometry \
     --header 'accept: application/json' \
     --header 'content-type: application/json' \
     --header 'x-stl-key: [API Key]' \
     --data '
{
  "geometry": {
    "nearest": {
      "point": {
        "type": "point",
        "coordinates": [
          -118.224619,
          33.989473
        ]
      },
      "number_segments": 10
    }
  },
  "country": "us",
  "mode": "vehicle",
  "osm_vintage": [202302]
}
'
The response includes segment ids and GeoJSON line strings along with a unique request ID. We can use these to visualize the geometry in a GIS tool and confirm that the correct segments are being queried.
You can use the response ID with the geometry/paging endpoint to page a previous geometry query. For more information, see Pagination.
The following example response is truncated for brevity.
{
  "columns": [
    "segment_id",
    "line_geometry"
  ],
  "data": [
    [
      3822128840000001,
      {
        "coordinates": [
          [
            -118.245353,
            34.0556552
          ],
          [
            -118.2455246,
            34.0554717
          ],
          [
            -118.2456838,
            34.0553016
          ]
        ],
        "type": "LineString"
      }
    ],
  ...
  ],
  "paging": null,
  "query_rows": 10,
  "request_id": "7b4857b7-e66e-4ac7-a306-e887e7eaac30",
  "status": "done"
}For more information, see /geometry.
4. Retrieve the metrics 📊
Now that we have counted the StreetLight segments in our geometry and retrieved geometry data, we can retrieve the metrics for the geometry using the metrics endpoint.
We can merge metrics with the geometry data from the geometry endpoint to visualize the metrics for each segment. For more information, see the following recipe:
Segments queried in calls to the Metrics endpoint count against your segment quota. Each row returned from the metrics endpoint counts against your segment quota, even if you are querying the same segments. For more information, see Available Metrics. Save and store these metrics when you get them.
The following parameters are required:
geometry: The geometry defined in the previous requests.fields: These are the different metrics we can request. In this case, we are interested in segment IDs, year and month of the data, and trip volume. If the restaurant company built fine dining restaurants, they could use such as trip_purpose or income if they wanted to advertise to a specific demographic. For a complete list, see Available Metrics.country: For this example, we are studying the US.mode: We are only interested in vehicles.source: Theagpsdata source has the widest range of data.osm_vintage: We'll use the OSM snapshot from February 2023. This parameter is required for theagpssource.day_part: We will look at all parts of the dayday_type: We are looking at all days of the week.direction: Drivers going either direction can turn into this site, so we choose bidirectional.date: We are interested in data from the entire year of 2021.
You can see how the choices above are entered in the example call below.
curl --request POST \
     --url https://api.streetlightdata.com/satc/v1/metrics \
     --header 'accept: application/json' \
     --header 'content-type: application/json' \
     --header 'x-stl-key: [API_KEY]' \
     --data '
{
  "geometry": {
    "nearest": {
      "point": {
        "type": "point",
        "coordinates": [
          -118.224968,
          33.987018
        ]
      },
      "number_segments": 10
    }
  },
  "fields": [
    "segment_id",
    "year_month",
    "trips_volume",
    "osm_vintage"
  ],
  "country": "us",
  "mode": "vehicle",
  "source": "agps",
  "osm_vintage": [202302],
  "day_part": "all",
  "day_type": "all",
  "direction": "bidirectional",
  "date": {
    "year": 2021
  }
}
'
The following example response shows the columns returned and the contents of one row. The rest of the rows have been omitted for brevity.
{
  "columns": [
    "segment_id",
    "year_month",
    "trips_volume"
  ],
  "data": [
    [
      3822128840000001,
      "2021-01-01",
      9723
    ],
...
  ],
  "data_version": 1,
  "query_rows": 10,
  "request_id": "7cf62200-d6e5-4a34-9e30-306884b1dfdb",
  "status": "done"
}
So the segment ID is 3822128840000001, the data is for 2021, and the trip volume is 9723.
You can use the response ID with the metrics/paging endpoint to page a previous metrics query. For more information, see "/metrics/paging".
For more information, see /metrics.
If we requested metrics for enough data, the response would be paginated, and include a URL for the next page. Log or save this URL so that you can return to it. For more information, see Pagination.
Success!The restaurant company can compare this data with data from other potential sites in order to decide on where to build a new location.
You can use these calls as an example to make your own calls with the StreetLight Advanced Traffic Counts API, or you can use the API Reference to learn more and create your own.
Updated 3 months ago