
Analyze a Large Area with Multiple Analyses
StreetLight InSight® Planning API
Analysis types in StreetLight InSight® Planning have a maximum number of zones you can analyze in one analysis. For example, with a Segment Analysis, we can analyze up to 1000 zones in one analysis. This is to manage resources and ensure that analyses are processed in a reasonable amount of time, however if you wanted to analyze more than 1000 segments, you would need to run more than one analysis. Then, you would have to visualize results separately in the app, or manually combine CSV results to do further analysis.
With the StreetLight InSight® Planning API, we can automate the creation of multiple analyses to analyze a large area, and then the merging of metrics to visualize results in one view. Creating a script allows us to:
- Quickly create analyses
- Ensure analyses are consistent
- Reuse the script for similar scenarios
In this example, we will analyze around 2,500 segments in Atlanta, GA. To do this we will follow these steps:
- Break up shapefile of segments into multiple zone sets
- Run a Segment Analyses with the same settings for each zone set
- Merge metrics from all the analyses and add them to the original geometry
- Visualize the metrics on a map with Python or GIS.
PrerequisitesYou need the following to run the requests as described in this example:
- API key
- StreetLight InSight® login email
- Installations of the required Python libraries
You can use the example calls below as a starting point for your own calls with Python or a Jupyter notebook. Replace
api_keywith your own API key as a string andlogin_emailwith your StreetLight InSight® login email as a string for the calls to be successful.
Import libraries 📚
Ensure you have each of the imported libraries installed.
import geopandas as gpd
import json
import requests
import time
import pandas as pd
import matplotlib.pyplot as plt
Convert shapefile into multiple feature collections 🗺️
This example uses a shapefile downloaded from StreetLight InSight® Planning. If you are using your own shapefile, ensure it is set up to work with StreetLight InSight. For more information, see Prepare a shapefile for upload.
For help preparing your shapefile to work with StreetLight InSight® Planning, you can use this recipe.
shapefile_path = "ShapefilePath.shp"  # Replace with the path to your shapefile
zones_gdf = gpd.read_file(shapefile_path)
zones_gdf = zones_gdf.to_crs(4326)
geojson = json.loads(zones_gdf.to_json())
Next, we split GeoJSON into chunks of FeatureCollections based on the zone limit of our analysis type. For a list of zone limits, see Zone limits for analysis types.
chunk_size = 500 # Enter zone limit here
features = geojson["features"]
feature_collections = [
    {
        "type": "FeatureCollection",
        "features": features[i:i + chunk_size]
    }
    for i in range(0, len(features), chunk_size)
]
Create zone sets 🛣️
Create a zone set for each chunked feature collection with the Create a zone set endpoint.
You can alter how each zone set is named. Zone sets will appear in your StreetLight InSight® Planning web app.
zone_set_uuids = []
for i, feature_collection in enumerate(feature_collections):
    url = f"https://insight.streetlightdata.com/api/v2/zone_sets?key={api_key}"
    headers = {
        "accept": "application/json",
        "content-type": "application/json"
    }
    payload = {
        "insight_login_email": login_email,
        "zone_set_name": f"Zone_Set_{i+1}",
        "zones": feature_collection
    }
    response = requests.post(url, headers=headers, json=payload)
    if response.status_code == 201:
        zone_set_uuids.append(response.json()["uuid"])
    else:
        print(f"Failed to create zone set: {response.text}")
    time.sleep(1)  # Waits to avoid hitting rate limit of 1 request per second

for uuid in zone_set_uuids:
    print(uuid)
Run an analyses for each zone set ⚙️
For each zone set, create and run an analysis with identical configuration settings with the Create and run an analysis endpoint. Running multiple analyses allows you to analyze more zones than the zone limit for the analysis type.
Due to the size of each zone set, these analyses may take a while to process.
analysis_uuids = []
for i, zone_set_uuid in enumerate(zone_set_uuids):
    url = f"https://insight.streetlightdata.com/api/v2/analyses?key={api_key}"
    headers = {"accept": "application/json", "content-type": "application/json"}
    payload = {
        "insight_login_email": login_email,
        "analysis_name": f"Segment_Analysis_{i+1}",
        "analysis_type": "Segment_Analysis",
        "travel_mode_type": "All_Vehicles_CVD_Plus",
        "oz_sets": [{ "uuid": zone_set_uuid}],
        "date_ranges": [
            {
                "start_date": "01/01/2023",
                "end_date": "04/30/2023"
            }
        ],
         "enable_visualization": True,
    }
    response = requests.post(url, headers=headers, json=payload)
    if response.status_code == 201:
        analysis_uuids.append(response.json()["uuid"])
        print(f"Created analysis: {response.text}")
    else:
        print(f"Failed to create analysis: {response.text}")
    time.sleep(1)  # Waits to avoid hitting rate limit of 1 request per second
Download and merge metrics for all analyses 📊
For each analysis, download the metrics with the Get Metrics by UUID endpoint and append them to a GeoDataFrame with metrics for all analyses.
This saves the GeoDataFrame to a file before processing in case it needs to be referenced later.
merged_metrics = []
for uuid in analysis_uuids:
    url = f"https://insight.streetlightdata.com/api/v2/analyses/download/uuid/{uuid}/sa_all?key={api_key}"
    headers = {"accept": "text/csv"}
    response = requests.get(url, headers=headers)
    if response.status_code == 200:
        # Read the CSV response into a GeoDataFrame
        csv_data = response.text
        # Write the CSV response to a temporary file
        temp_file_path = f"Segment_Analysis_{uuid}.csv"
        with open(temp_file_path, "w") as temp_file:
            temp_file.write(csv_data)
        # Read the temporary file into a GeoDataFrame
        temp_gdf = pd.read_csv(temp_file_path)
        temp_gdf = gpd.GeoDataFrame(temp_gdf)
        merged_metrics.append(temp_gdf)
    else:
        print(f"Failed to fetch metrics for UUID {uuid}: {response.text}")
    time.sleep(1)  # Waits to avoid hitting rate limit of 1 request per second
merged_gdf = gpd.GeoDataFrame(pd.concat(merged_metrics, ignore_index=True))
print(merged_gdf)
Filter GeoDataFrame and add metric to original geometry 🌐
The metrics include all breakdowns of day types and day parts. Since we only want to visualize one metric, we'll filter the metrics to be one specified Day Type and Day Part.
Then, we'll add the metric we want (Average daily segment traffic) to the GeoDataFrame that contains the geometry for each zone. To do this, we add the metric for each row using the Zone Name to map the rows, since the zone names will match in the Zones and the Metrics GeoDataFrame.
# Filter merged_gdf to only keep rows with the specified Day Type and Day Part
filtered_gdf = merged_gdf[
    (merged_gdf["Day Type"] == "0: All Days (M-Su)") &
    (merged_gdf["Day Part"] == "0: All Day (12am-12am)")
]

# Map the "Average Daily Segment Traffic (StL Volume)" from filtered_gdf to gdf based on "Zone Name"
zone_name_to_traffic = filtered_gdf.set_index("Zone Name")["Average Daily Segment Traffic (StL Volume)"].to_dict()
zones_gdf["Average Daily Segment Traffic (StL Volume)"] = zones_gdf["name"].map(zone_name_to_traffic)
zones_gdf["Average Daily Segment Traffic (StL Volume)"] = zones_gdf["Average Daily Segment Traffic (StL Volume)"].astype(float)

# Print the updated gdf
print(zones_gdf)
Plot and save the results 💾
We can create a simple plot of the GeoDataFrame to verify our processing.
import contextily as ctx

fig, ax = plt.subplots(1, 1, figsize=(15, 10))
ax.set_title("Average Daily Segment Traffic (StL Volume)", fontsize=16)
zones_gdf.plot(column="Average Daily Segment Traffic (StL Volume)", ax=ax, cmap="viridis", linewidth=2)
ctx.add_basemap(ax, zoom=15, source=ctx.providers.OpenStreetMap.Mapnik, crs=zones_gdf.crs, )
plt.show()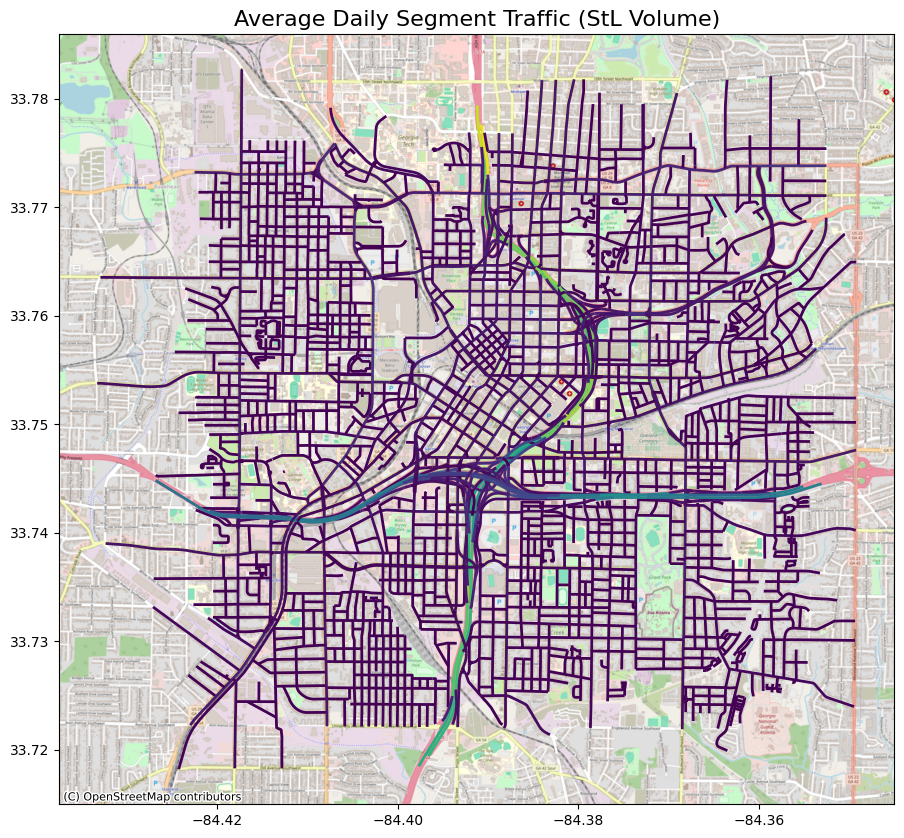
We can also save the GeoDataFrame as GeoJSON file and import it into our GIS software for further processing
output_geojson_path = "zones_and_metrics.geojson"
zones_gdf.to_file(output_geojson_path, driver="GeoJSON")
print(f"Merged metrics saved to {output_geojson_path}")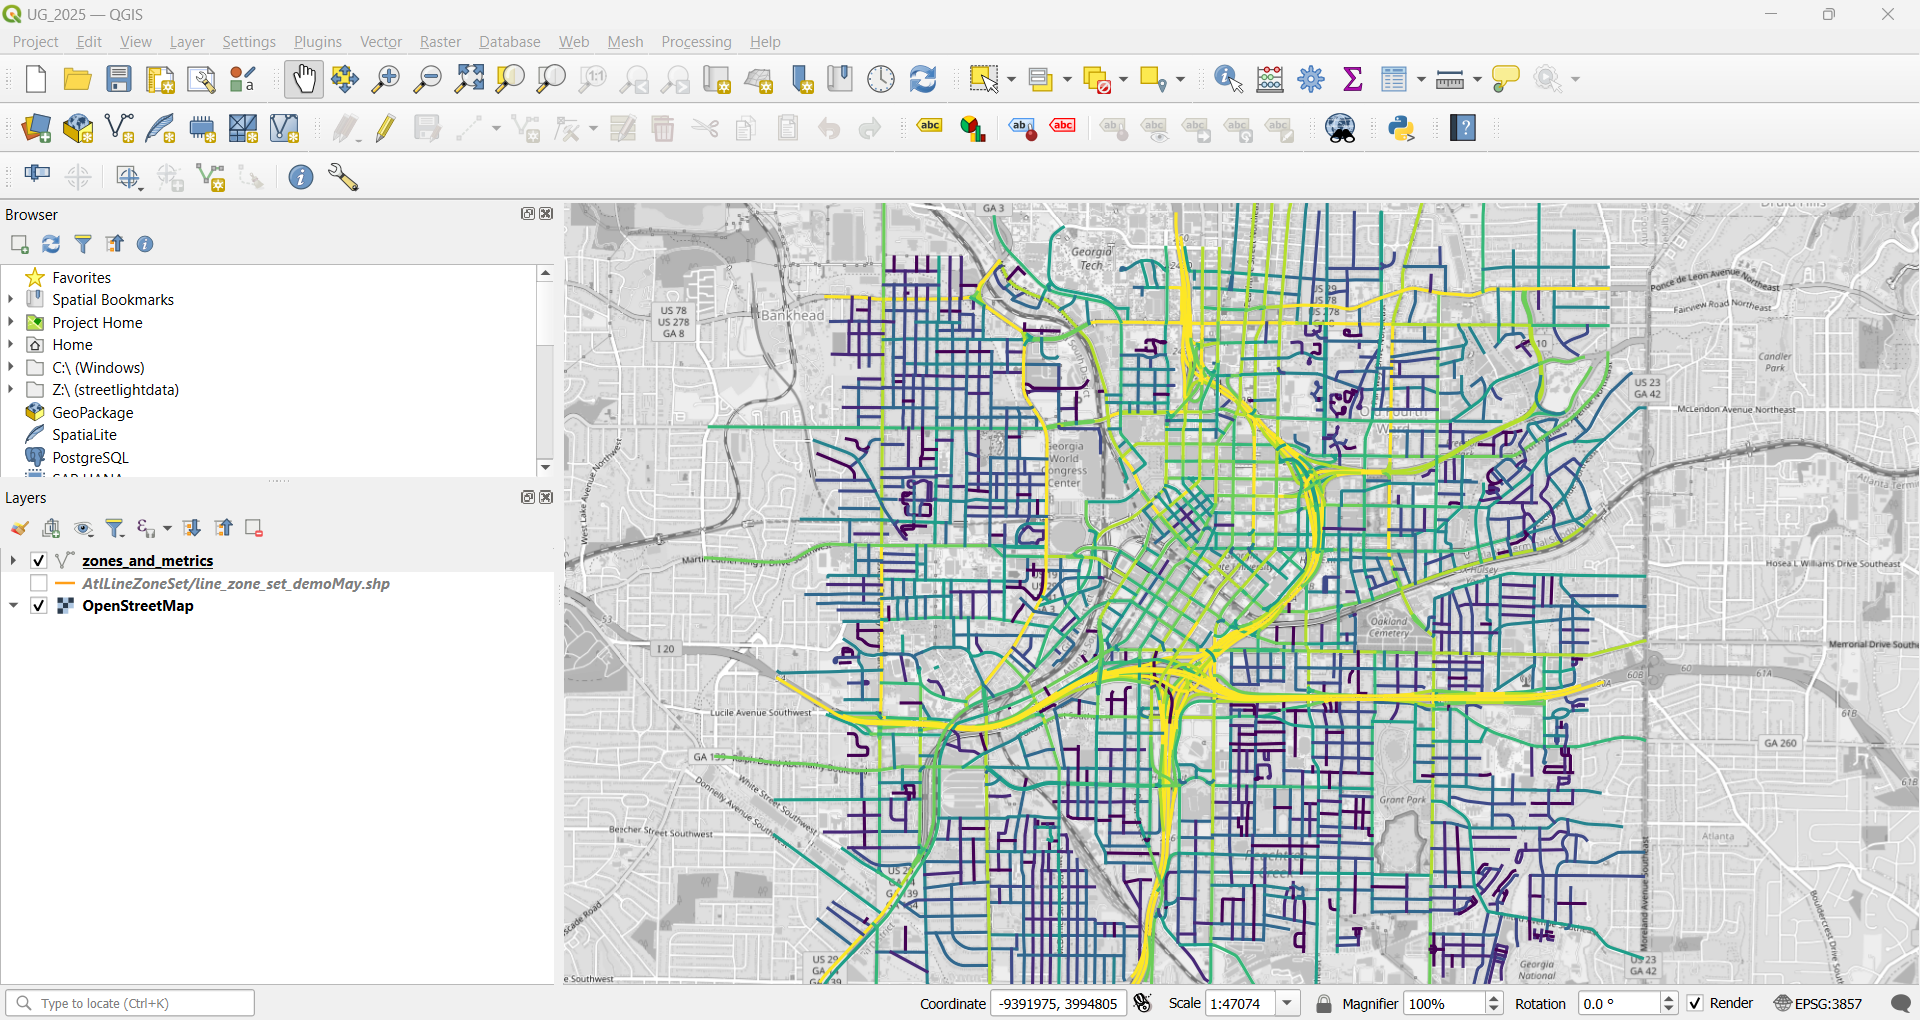
Updated 10 months ago